Figure组成🔗
Matplotlib是一个Python的绘图库,它在Figure上绘制图像,每个Figure可以包含多个Axes,每个Axes可以理解为一幅图。
Figure🔗
Figure是整个图形的容器,一般使用下面函数之一创建一个Figure:
fig = plt.figure()             # an empty figure with no Axes
fig, ax = plt.subplots()       # a figure with a single Axes
fig, axs = plt.subplots(2, 2)  # a figure with a 2x2 grid of Axes
# a figure with one Axes on the left, and two on the right:
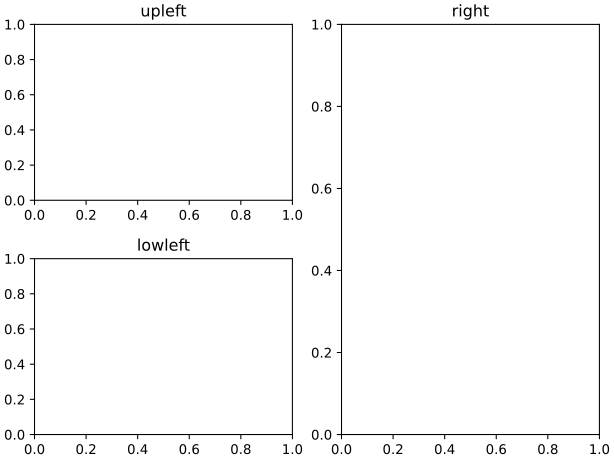
fig, axs = plt.subplot_mosaic([['left', 'right_top'],
['left', 'right_bottom']])Axes🔗
Axes是一个具有数据空间的图像区域,每个Axes都有一个标题(set_title())、一个x轴标签(set_xlabel())和一个y轴标签(set_ylabel())。Axes是绘图的主要部分。
Axis🔗
Axis设置刻度和限制,并有刻度和刻度标签,刻度位置由Locator确定,刻度标签由Formatter确定。
Artist🔗
在Figure上绘制的所有对象都是Artist,Artist包括Axes、Axis、Line2D等。
绘图函数输入🔗
绘图函数的输入一般来讲是numpy.array或numpy.ma.masked_array,或是其他可以传递给numpy.array的对象。若是像numpy.matrix和pandas的数据对象一般需要先转换为numpy.array:
b = np.matrix([[1, 2], [3, 4]])
b_asarray = np.asarray(b)大多数方法还能解析可字符串索引的对象,例如dict,structured numpy array或pandas.DataFrame,提供数据的索引作为x和y参数:
np.random.seed(19680801) # seed the random number generator.
data = {'a': np.arange(50),
'c': np.random.randint(0, 50, 50),
'd': np.random.randn(50)}
data['b'] = data['a'] + 10 * np.random.randn(50)
data['d'] = np.abs(data['d']) * 100
fig, ax = plt.subplots(figsize=(5, 2.7), layout='constrained')
ax.scatter('a', 'b', c='c', s='d', data=data)
ax.set_xlabel('entry a')
ax.set_ylabel('entry b')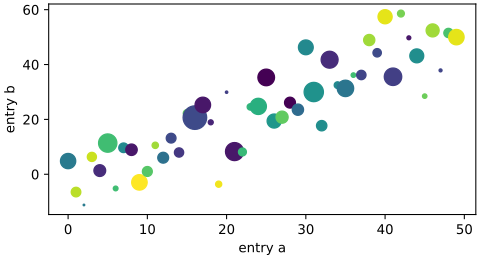 上面代码先创建了一个叫
data的dict,装了a,b,c,d四个数组,然后使用scatter函数绘制散点图,x和y参数分别是a和b,color参数是c,size参数是d。
代码风格🔗
显示接口和隐示接口🔗
有两种使用Matplotlib的方法,一种是显式创建Figures和Axes,然后调用它们的方法(OO风格),例如ax.plot(x, y),另一种是使用pyplot的隐式接口,例如plt.plot(x, y),这种方法会自动创建Figures和Axes,然后调用它们的方法(pyplot风格)。
第一种如下:
x = np.linspace(0, 2, 100)  # Sample data.

# Note that even in the OO-style, we use `.pyplot.figure` to create the Figure.
fig, ax = plt.subplots(figsize=(5, 2.7), layout='constrained')
ax.plot(x, x, label='linear')  # Plot some data on the Axes.
ax.plot(x, x**2, label='quadratic')  # Plot more data on the Axes...
ax.plot(x, x**3, label='cubic')  # ... and some more.
ax.set_xlabel('x label')  # Add an x-label to the Axes.
ax.set_ylabel('y label')  # Add a y-label to the Axes.
ax.set_title("Simple Plot")  # Add a title to the Axes.
ax.legend()  # Add a legend.
第二种如下:
x = np.linspace(0, 2, 100)  # Sample data.

plt.figure(figsize=(5, 2.7), layout='constrained')
plt.plot(x, x, label='linear')  # Plot some data on the (implicit) Axes.
plt.plot(x, x**2, label='quadratic')  # etc.
plt.plot(x, x**3, label='cubic')
plt.xlabel('x label')
plt.ylabel('y label')
plt.title("Simple Plot")
plt.legend()
另外还有第三种方法,用于将Matplotlib嵌入GUI应用程序中,但这种方法不常用。
一般来说,在复杂的项目中建议使用OO风格,而在需要快速交互工作时,pyplot风格会很方便。
创建辅助函数🔗
可以写函数来简化我们的操作:
def my_plotter(ax, data1, data2, param_dict):
    """
    A helper function to make a graph.
    """
    out = ax.plot(data1, data2, **param_dict)
    return out

data1, data2, data3, data4 = np.random.randn(4, 100)  # make 4 random data sets
fig, (ax1, ax2) = plt.subplots(1, 2, figsize=(5, 2.7))
my_plotter(ax1, data1, data2, {'marker': 'x'})
my_plotter(ax2, data3, data4, {'marker': 'o'})这里定义了一个函数my_plotter,然后绘制了两个图。
Artists风格🔗
对于Artists的样式选择,可以在绘图时指定,也可以在绘图使用setter指定:
fig, ax = plt.subplots(figsize=(5, 2.7))
x = np.arange(len(data1))
ax.plot(x, np.cumsum(data1), color='blue', linewidth=3, linestyle='--')
l, = ax.plot(x, np.cumsum(data2), color='orange', linewidth=2)
l.set_linestyle(':')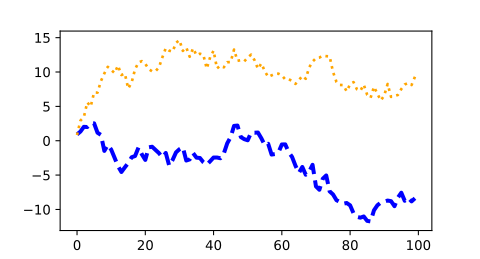 这里第一条线在绘图时指定了
linestyle,第二条线在绘图后使用set_linestyle指定了linestyle。
颜色🔗
对于颜色的定义,参照Specifying colors,对于一个scatter,标记边缘和内部可以是不同颜色:
fig, ax = plt.subplots(figsize=(5, 2.7))
ax.scatter(data1, data2, s=50, facecolor='C0', edgecolor='k')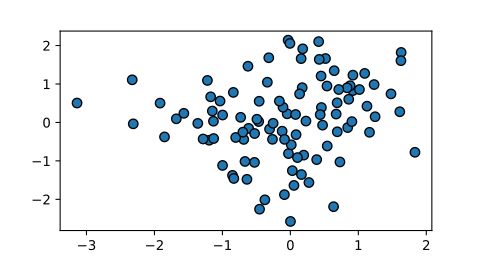
线宽、线型和标记大小🔗
线宽一般是以点为单位,用于有线条的Artists,线型的定义参照Linestyles。
标记的大小取决于绘图的方法,plot大小是一个点,scatter大小与可视区域成比例。标记的样式定义可以参照matplotlib.markers:
fig, ax = plt.subplots(figsize=(5, 2.7))
ax.plot(data1, 'o', label='data1')
ax.plot(data2, 'd', label='data2')
ax.plot(data3, 'v', label='data3')
ax.plot(data4, 's', label='data4')
ax.legend()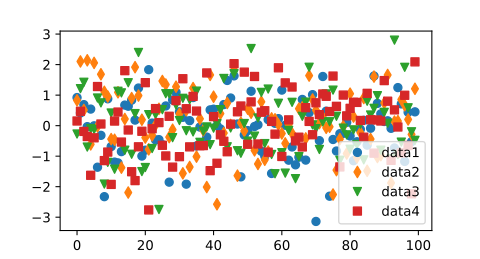
标签🔗
Axes标签和文本🔗
用set_xlabel、set_ylabel和set_title在指定位置添加文本,也可以用text添加文本到绘图中(详细见Text in Matplotlib):
mu, sigma = 115, 15
x = mu + sigma * np.random.randn(10000)
fig, ax = plt.subplots(figsize=(5, 2.7), layout='constrained')
# the histogram of the data
n, bins, patches = ax.hist(x, 50, density=True, facecolor='C0', alpha=0.75)
ax.set_xlabel('Length [cm]')
ax.set_ylabel('Probability')
ax.set_title('Aardvark lengths\n (not really)')
ax.text(75, .025, r'$\mu=115,\ \sigma=15$')
ax.axis([55, 175, 0, 0.03])
ax.grid(True)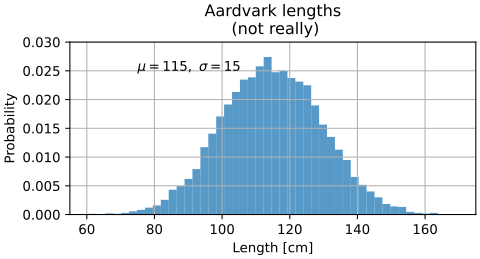 所有函数
text方法都会返回一个matplotlib.text.Text实例,可以通过传入参数来改变文本样式(详细见Text properties and layout):
t = ax.set_xlabel('my data', fontsize=14, color='red')在文本中使用数学表达式🔗
Matplotlib支持TeX数学表达式,使用$来表示数学表达式:
ax.set_title(r'$\sigma_i=15$')这里的r前缀表示里面内容是原始字符串而不是将反斜杠视为Python转义。Matplotlib内置有TeX表达式解析器和输出引擎,另外也可以使用LaTeX来进行文本渲染(详细见Text rendering with LaTeX)。
附注🔗
注释某个点,通常是用箭头指向该点,然后连接到一处文本:
fig, ax = plt.subplots(figsize=(5, 2.7))
t = np.arange(0.0, 5.0, 0.01)
s = np.cos(2 * np.pi * t)
line, = ax.plot(t, s, lw=2)
ax.annotate('local max', xy=(2, 1), xytext=(3, 1.5),
arrowprops=dict(facecolor='black', shrink=0.05))
ax.set_ylim(-2, 2)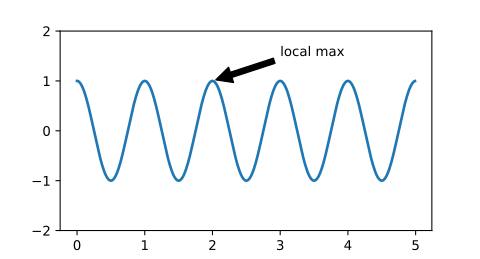 这个实例,使用
annotate方法添加了一个指向(2, 1)的箭头,箭头连接到(3, 1.5)。
图例🔗
一般我们使用legend方法来添加图例(详细见Legend guide):
fig, ax = plt.subplots(figsize=(5, 2.7))
ax.plot(np.arange(len(data1)), data1, label='data1')
ax.plot(np.arange(len(data2)), data2, label='data2')
ax.plot(np.arange(len(data3)), data3, 'd', label='data3')
ax.legend()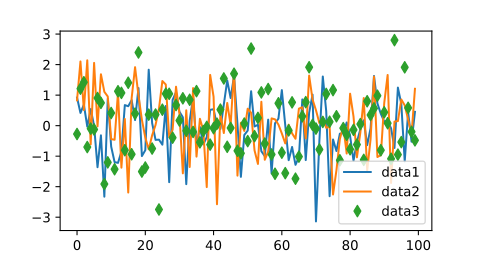
Axis刻度🔗
每个Axes都有两个或三个Axis对象,这些参数控制Axis的缩放、刻度定位和刻度格式。
Scales🔗
除了线性刻度,Matplotlib还提供了非线性刻度(例如对数刻度),有loglog、semilogx、semilogy等众多方法(详见Scales overview)。这里我们手动设置:
fig, axs = plt.subplots(1, 2, figsize=(5, 2.7), layout='constrained')
xdata = np.arange(len(data1)) # make an ordinal for this
data = 10**data1
axs[0].plot(xdata, data)
axs[1].set_yscale('log')
axs[1].plot(xdata, data)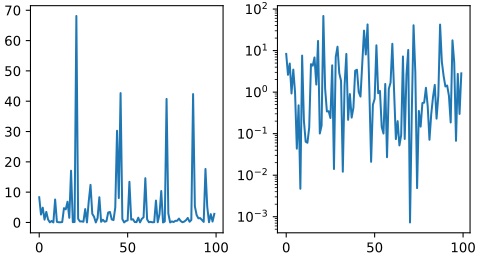 这里将第二幅图的y轴设置为对数刻度。
Tick🔗
每个Axis都有一个刻度定位和格式化工具用于选择刻度线和标签,这里一个简单的接口是set_xticks和set_yticks(详细见Tick locators和Tick formatters):
fig, axs = plt.subplots(2, 1, layout='constrained')
axs[0].plot(xdata, data1)
axs[0].set_title('Automatic ticks')
axs[1].plot(xdata, data1)
axs[1].set_xticks(np.arange(0, 100, 30), ['zero', '30', 'sixty', '90'])
axs[1].set_yticks([-1.5, 0, 1.5]) # note that we don't need to specify labels
axs[1].set_title('Manual ticks')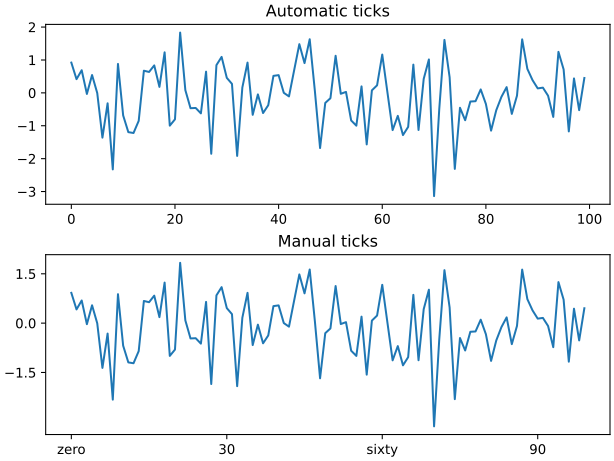 这里的第二幅图使用
set_xticks和set_yticks手动设置了刻度线位置和标签。
dates and strings🔗
对于日期,可以使用matplotlib.dates模块来处理日期,例如(详细见Date tick labels):
from matplotlib.dates import ConciseDateFormatter
fig, ax = plt.subplots(figsize=(5, 2.7), layout='constrained')
dates = np.arange(np.datetime64('2021-11-15'), np.datetime64('2021-12-25'),
np.timedelta64(1, 'h'))
data = np.cumsum(np.random.randn(len(dates)))
ax.plot(dates, data)
ax.xaxis.set_major_formatter(ConciseDateFormatter(ax.xaxis.get_major_locator()))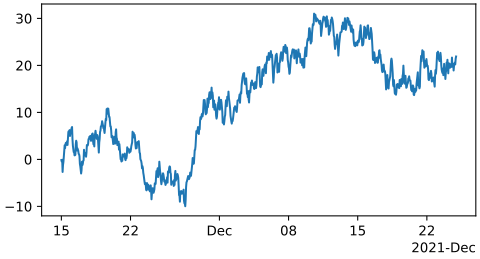 这里
dates生成了从2021-11-15到2021-12-25每个小时的日期序列,而data是根据dates生成的随机数据。
对于字符串,我们使用分类绘图(详细见Plotting categorical variables):
fig, ax = plt.subplots(figsize=(5, 2.7), layout='constrained')
categories = ['turnips', 'rutabaga', 'cucumber', 'pumpkins']

ax.bar(categories, np.random.rand(len(categories)))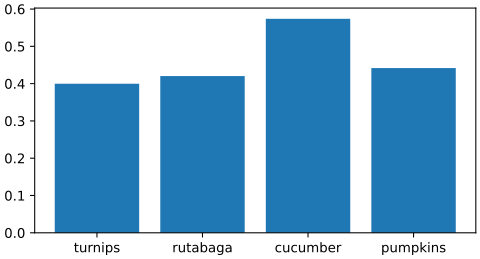
其他轴对象🔗
有些时候可能还需要额外的轴,这时可以使用twinx和twiny添加一副新图(详细见Plots with different scales),或使用secondary_xaxis和secondary_yaxis(详细见Secondary Axis)添加一个新轴:
fig, (ax1, ax3) = plt.subplots(1, 2, figsize=(7, 2.7), layout='constrained')
l1, = ax1.plot(t, s)
ax2 = ax1.twinx()
l2, = ax2.plot(t, range(len(t)), 'C1')
ax2.legend([l1, l2], ['Sine (left)', 'Straight (right)'])
ax3.plot(t, s)
ax3.set_xlabel('Angle [rad]')
ax4 = ax3.secondary_xaxis('top', (np.rad2deg, np.deg2rad))
ax4.set_xlabel('Angle [°]')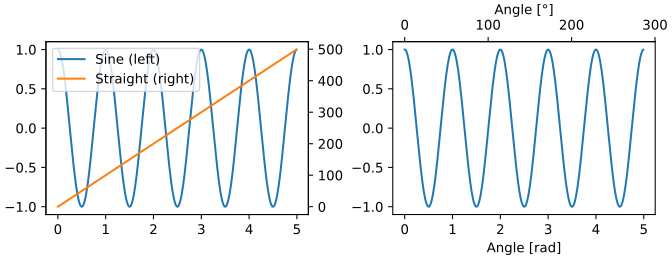 这里的第一幅图使用
twiny添加了一个新图,第二幅图使用secondary_xaxis添加了一个新轴。
颜色映射数据🔗
有时希望用颜色来表示第三个维度,在Matplotlib中有很多绘图类型可以做到这一点:
from matplotlib.colors import LogNorm
X, Y = np.meshgrid(np.linspace(-3, 3, 128), np.linspace(-3, 3, 128))
Z = (1 - X/2 + X**5 + Y**3) * np.exp(-X**2 - Y**2)
fig, axs = plt.subplots(2, 2, layout='constrained')
pc = axs[0, 0].pcolormesh(X, Y, Z, vmin=-1, vmax=1, cmap='RdBu_r')
fig.colorbar(pc, ax=axs[0, 0])
axs[0, 0].set_title('pcolormesh()')
co = axs[0, 1].contourf(X, Y, Z, levels=np.linspace(-1.25, 1.25, 11))
fig.colorbar(co, ax=axs[0, 1])
axs[0, 1].set_title('contourf()')
pc = axs[1, 0].imshow(Z**2 * 100, cmap='plasma', norm=LogNorm(vmin=0.01, vmax=100))
fig.colorbar(pc, ax=axs[1, 0], extend='both')
axs[1, 0].set_title('imshow() with LogNorm()')
pc = axs[1, 1].scatter(data1, data2, c=data3, cmap='RdBu_r')
fig.colorbar(pc, ax=axs[1, 1], extend='both')
axs[1, 1].set_title('scatter()')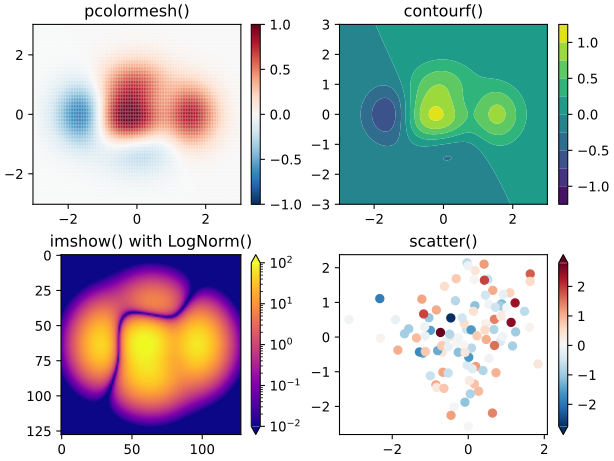 这里分别使用了
pcolormesh、contourf、imshow和scatter四种方法。
Colormaps🔗
这些都是ScalarMappableArtists,都可以将vmin和vmax之间的线性映射设置为cmap指定的Colormaps(Colormaps见Choosing Colormaps in Matplotlib)。
Normalization🔗
有时我们希望数据到颜色图的映射是非线性的,这个时候要提供norm参数而不是vmin和vmax参数(详细见Colormap normalization)。
Colorbar🔗
添加一个Colorbar用于查看颜色与数据的关系,用extend参数控制Colorbar的外观,用shrink和aspect参数控制大小。关于Colorbar的放置位置,见Placing colorbars。
使用多个Figures和Axes🔗
可以多次调用plt.figure()或plt.subplots()来创建多个Figure.
添加多个Axes有很多方法,可以用plt.subplots(),要添加更复杂的可以使用subplot_mosaic(详细见Arranging multiple Axes in a Figure和Complex and semantic figure composition (subplot_mosaic)):
fig, axd = plt.subplot_mosaic([['upleft', 'right'],
                               ['lowleft', 'right']], layout='constrained')
axd['upleft'].set_title('upleft')
axd['lowleft'].set_title('lowleft')
axd['right'].set_title('right')